In trading, price rarely moves randomly. It follows patterns, directions, and momentum. One of the simplest yet most powerful tools to identify that direction is the trendline.
A trendline is not a prediction tool. It is a structure tool. Traders who misuse it get confused. Traders who understand it gain clarity.
 What Is a Trendline?
A trendline is a straight line drawn on a price chart to connect key price points and highlight the overall direction of the market.
There are two primary types:
Uptrend Line: Drawn by connecting higher lows
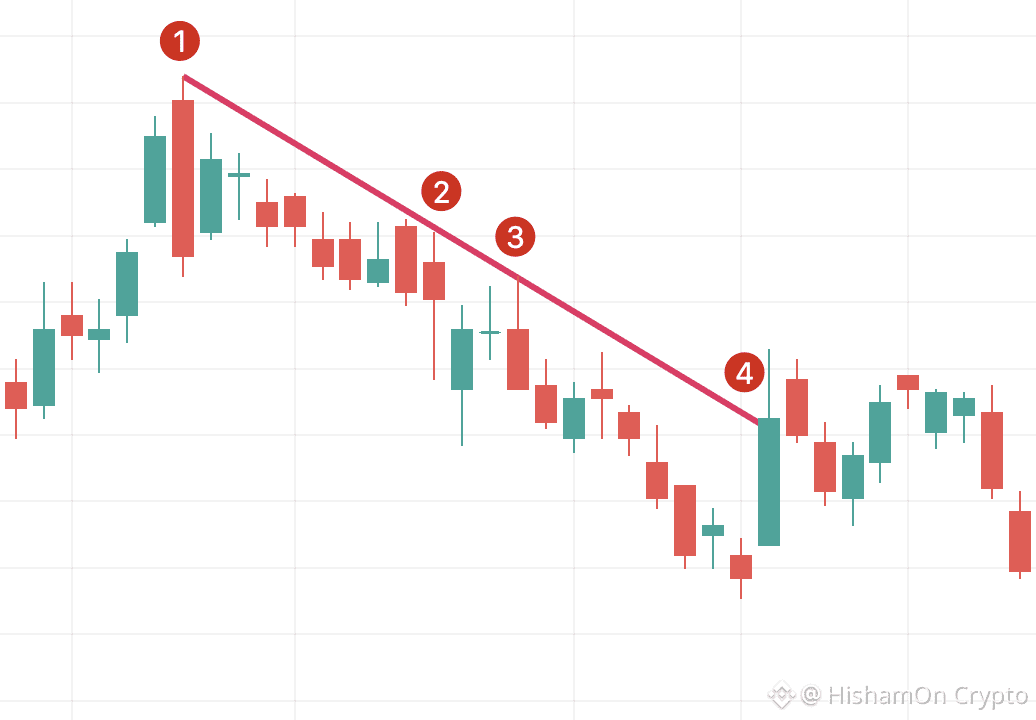
Downtrend Line: Drawn by connecting lower highs
If price respects the line repeatedly, the trend is valid. If it breaks, the trend is weakening or ending.
Simple concept. Powerful impact.
Why Trendlines Matter
Trendlines do three critical things:
Define Market Direction
They answer one question clearly:
Is the market going up, down, or sideways?
Act as Dynamic Support and Resistance
Unlike horizontal levels, trendlines move with price.
Price often reacts, bounces, or rejects from them.
Improve Trade Timing
Entries near trendline support or resistance offer better risk-to-reward setups.
Ignoring trendlines means trading without structure. That’s gambling.
How to Draw a Correct Trendline
Most traders draw trendlines incorrectly. Don’t be one of them.
Follow these rules:
Use at least two clear touchpoints (three is stronger)
Connect wicks, not random candles
Do not force the line to fit your bias
Adjust the line as new price data forms
A trendline must be respected by price, not by your imagination.
Common Uses of Trendlines in Trading
1. Trend Identification
If price stays above an uptrend line → bullish bias
If price stays below a downtrend line → bearish bias
Trade with the trend, not against it.
2. Entry and Exit Zones
Buy near uptrend support in bullish markets
Sell near downtrend resistance in bearish markets
Chasing breakouts without confirmation is a rookie mistake.
3. Breakout and Breakdown Signals
A confirmed break of a strong trendline often signals:
Trend reversal
Momentum shift
Volatility expansion
But one candle is not confirmation. Wait for structure.
4. Risk Management
Trendline breaks help define:
Stop-loss placement
Trade invalidation points
If the structure breaks, your idea is wrong. Accept it and move on.
Trendlines on Binance Charts
On Binance, traders can draw trendlines using the TradingView chart tools available on both desktop and mobile.
Combine trendlines with:
EMA or Moving Averages
Volume analysis
Market structure (higher highs, lower lows)
Trendlines alone are useful. Trendlines with confluence are deadly accurate.
Final Thoughts
Trendlines are not magic. They don’t guarantee profits. They don’t predict the future.
What they do is remove noise, define structure, and force discipline.
If you can’t draw a clean trendline, you shouldn’t be placing trades.
Master the basics — because in trading, simplicity beats complexity every time.
.