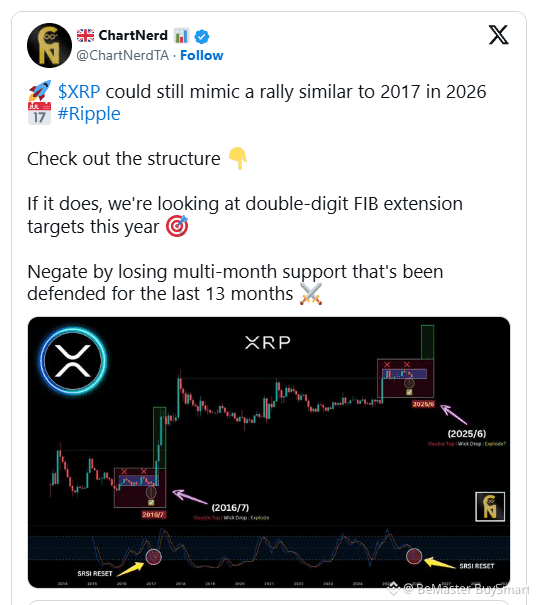
$XRP could be preparing for a major upward move, echoing patterns seen in 2017. A recent chart shared by crypto analyst ChartNerd (@ChartNerdTA) highlights a comparison between 2017 and the current price action leading into 2026. The analysis suggests that if history repeats, XRP may experience a significant rally toward double digits.
👉Historical Patterns Repeat
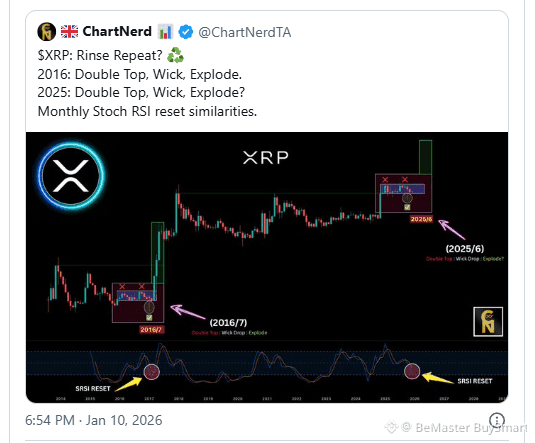
ChartNerd points to a series of patterns, including a double top, a wick drop, and a price explosion. This sequence appeared in 2016/17, preceding a strong surge in price. The analyst suggests that similar conditions could be setting up now. The current chart shows XRP consolidating in a narrow range for over a year, mirroring the pre-rally compression seen in 2016.
The chart indicates that XRP is approaching a key decision point. Multi-month support has been defended for the last 13 months. Holding this level is critical for any potential upside. Losing it could invalidate the bullish scenario, while maintaining it may set the stage for a repeat of past performance.
👉SRSI Reset Signals Shift
An important technical signal highlighted in the chart is the SRSI reset. ChartNerd marked the SRSI reset both in 2017 and currently, indicating a potential turning point. This technical indicator suggests the market may be ready to shift momentum from consolidation to an upward trajectory.
The price action on the chart suggests a breakout potential above the consolidation zone. In 2016, breaking this pattern led to a rapid price increase. The projection for 2026 shows a similar structure, with the green zones suggesting strong potential gains if the breakout occurs.
👉XRP’s Path Forward
Historical context strengthens this analysis. In 2016, XRP traded in a sideways pattern for several months before triggering a sharp rally. The current setup closely mirrors that timeframe, suggesting that the market may be entering a comparable phase.
The chart also shows clear rejection at the double top areas, emphasizing the importance of maintaining support to sustain a bullish outlook. If the market replicates the 2016 sequence, XRP could reach double-digit Fibonacci extension targets during this cycle.
XRP’s chart indicates the market is positioned at a critical point. Historical parallels, technical resets, and strong multi-month support suggest that the stage is set for a potential breakout. The outcome in the coming months will determine if XRP can follow the trajectory seen in 2017.
🚀🚀🚀 FOLLOW BE_MASTER BUY_SMART 💰💰💰
Appreciate the work. 😍 Thank You. 👍 FOLLOW BeMaster BuySmart 🚀 TO FIND OUT MORE $$$$$ 🤩 BE MASTER BUY SMART 💰🤩
🚀🚀🚀 PLEASE CLICK FOLLOW BE MASTER BUY SMART - Thank You.
