$ETH Ethereum is sandwiched between two major liquidity clusters, with concentrated levels above $3,150 and below $3,050. These zones could trigger heightened volatility as price approaches either side.
👉 Ethereum is trading in a critical zone between two massive liquidity clusters that could dictate its next move. The heatmap data shows heavy liquidity concentration on both sides of current price—a thick band above between $3,150 and $3,250, and another cluster below in the $3,000 to $3,050 range. These aren't random levels. They're where the action tends to heat up.
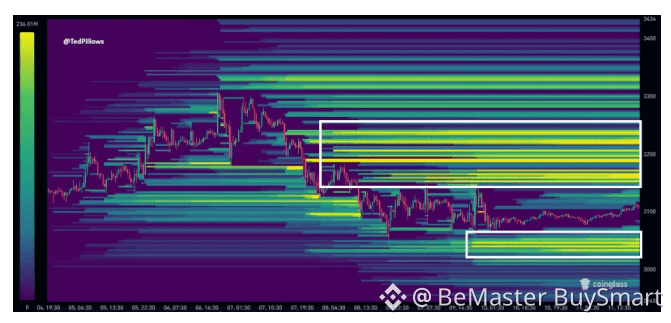
👉 Looking upward, there's a dense wall of liquidity tied to short liquidations stacked between $3,150 and $3,250. This zone is packed with leveraged short positions that would get forced out if price pushes higher. When ETH approaches these levels, things can get volatile fast. Forced buying from liquidations often creates momentum that feeds on itself, accelerating upward moves once the level gets tested.
👉 Below current price, another liquidity cluster sits near $3,000 to $3,050. This lower band shows concentrated resting orders and potential long liquidations waiting to trigger. The chart reveals ETH has already interacted with this zone's upper edge before stabilizing. During pullbacks, liquidity below price tends to pull price toward it like a magnet, especially when markets are range-bound.
👉 Why this matters: when liquidity piles up both above and below current levels, markets usually gravitate toward these zones as orders get absorbed. With ETH caught between these two clusters near $3,000, short-term price action will likely be shaped by how traders and algorithms interact with these areas. Expect volatility to spike as either zone gets tested.
🚀🚀🚀 FOLLOW BE_MASTER BUY_SMART 💰💰💰
Appreciate the work. 😍 Thank You. 👍 FOLLOW BeMaster BuySmart 🚀 TO FIND OUT MORE $$$$$ 🤩 BE MASTER BUY SMART 💰🤩
🚀🚀🚀 PLEASE CLICK FOLLOW BE MASTER BUY SMART - Thank You.
