$XRP Crypto analyst JD (@jaydee_757) has presented a technical assessment of XRP that centers on a bearish divergence identified near a recent local high.
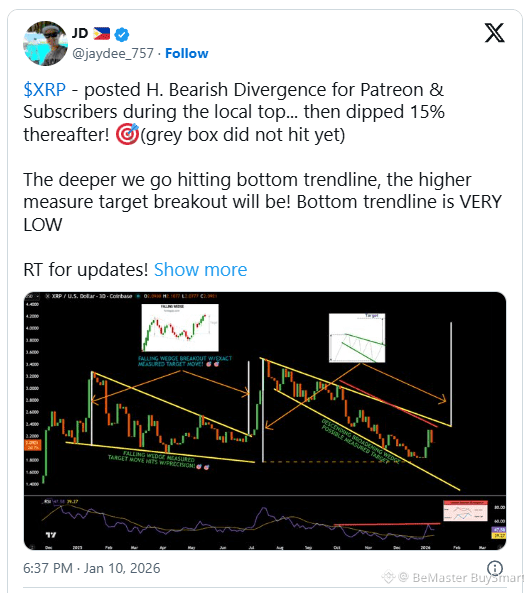
According to his analysis, this signal was communicated to subscribers ahead of the subsequent market reaction. Price action following that point moved sharply lower, with XRP recording a decline of roughly 15%. The move validated the relevance of the divergence signal as an early warning of weakening momentum despite price strength at the time.
The chart shared by the analyst puts this development within a structural context rather than treating it as an isolated event. The divergence, visible on the relative strength index, suggested that upside momentum was deteriorating even as the price attempted to hold higher levels. This condition, in JD’s view, justified caution and reinforced expectations for a corrective phase.
👉Measured Moves Within a Falling Wedge Structure
JD’s analysis focuses heavily on long-term pattern behavior visible on the multi-day chart. The chart attached outlines a falling wedge formation that has guided XRP’s price action through extended periods of decline and consolidation. Historically, similar structures on the chart have produced measured moves that aligned closely with projected targets once a breakout occurred.
The analyst highlights that previous downside movements respected the wedge’s internal trendlines, eventually reaching measured targets with notable precision. This historical behavior is used to frame expectations for the current setup. While price has already moved lower, JD notes that the chart’s pattern suggests the structure remains incomplete, with the lower boundary of the wedge not yet fully tested.
👉Lower Price Levels Linked to Higher Breakout Targets
A key point emphasized in the analysis is the relationship between downside extension and upside potential. JD explains that the deeper price moves toward the bottom trendline of the wedge, the larger the projected breakout target becomes once a reversal is confirmed.
In this context, the lower boundary of the structure is described as being significantly below current price levels, implying that additional downside cannot be ruled out.
This perspective was further clarified in a direct response to a question from another market participant, who asked whether XRP could revisit price zones last seen around October.
JD indicated that a move toward lower levels would not invalidate the bullish breakout thesis but would instead increase the magnitude of the eventual upside move, provided the structure resolves as anticipated.
👉Cautious Near-Term View With Long-Term Implications
The overall tone of the analysis remains cautious in the short term, while constructive over a longer horizon. The presence of hidden bearish signals on momentum indicators suggests that volatility may persist, particularly if the price continues to gravitate toward structural support. At the same time, the wedge positions any deeper retracement as a potential contributor to a larger measured breakout in the future.
JD’s assessment does not attempt to assign a specific timeline but instead stresses the importance of structure, confirmation, and patience. As XRP continues to trade within these defined boundaries, the focus remains on how the price interacts with the lower trendline and whether historical pattern behavior repeats with similar accuracy.
🚀🚀🚀 FOLLOW BE_MASTER BUY_SMART 💰💰💰
Appreciate the work. 😍 Thank You. 👍 FOLLOW BeMaster BuySmart 🚀 TO FIND OUT MORE $$$$$ 🤩 BE MASTER BUY SMART 💰🤩
🚀🚀🚀 PLEASE CLICK FOLLOW BE MASTER BUY SMART - Thank You.
