

Hi,
Let's take a look at the BTCUSD chart on the H3 timeframe.
Price is holding above the 9, 10, 12, and 15 EMAs from a previous background test and is currently hovering above the 21 and 25 EMAs, which are both above the 50 EMA.
The 50 EMA is above the 100 EMA, and the 100 EMA is above the 200 EMA, both confirmed by background checks.
Overall, the trend remains bullish, but price is starting to run into some technical resistance.
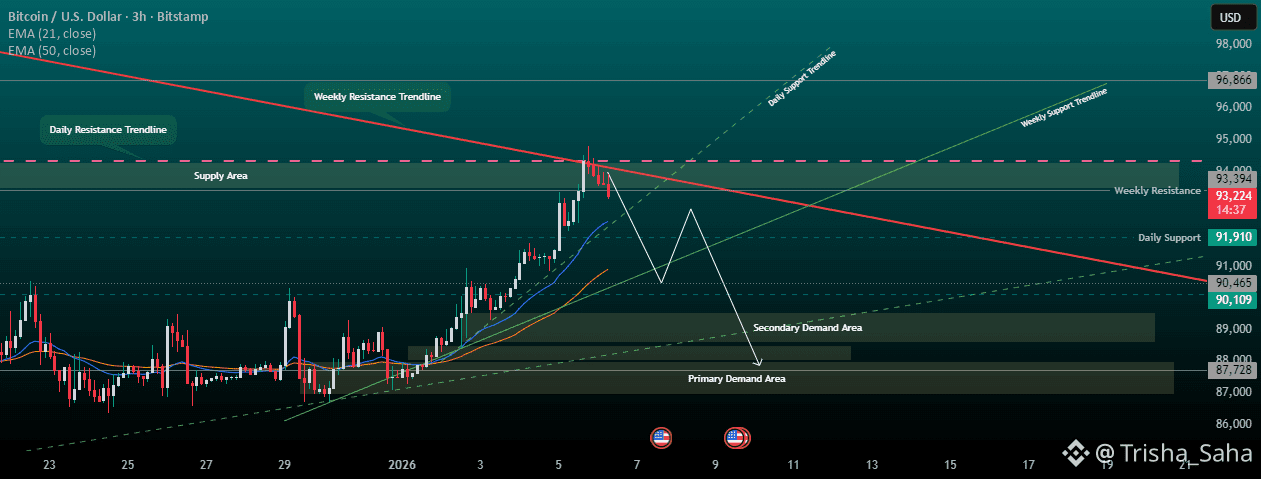
On Structure:-
Price is rejecting the weekly solid trendline resistance, lining up with the daily dashed trendline resistance. This is creating bearish pressure around the 94,401 high, which we’ll mark as the supply area. From here, price could pull back toward the previous daily support just above the 21 EMA and potentially down to the 50 EMA. That puts the weekly support trendline as the first key target and a likely bounce zone. However, if liquidity shifts, price could push lower and test buyers around 88K.
In short, this looks like a normal pullback within a larger bullish trend—unless the weekly supply zone causes a broader trend shift.
Happy Trading,
