

Support and resistance lines on candlestick charts (uptrends and downtrends)
Breaking low and rising pattern and breaking high and falling pattern (range oscillation)
Polarity Reversal Principle — past support levels become new resistance levels; past resistance levels become new support levels.
**The technological potential of the polarity reversal phenomenon is proportional to the following aspects:**
1. The number of times the market has tested past support/resistance levels. 2. The volume and position size of each test.
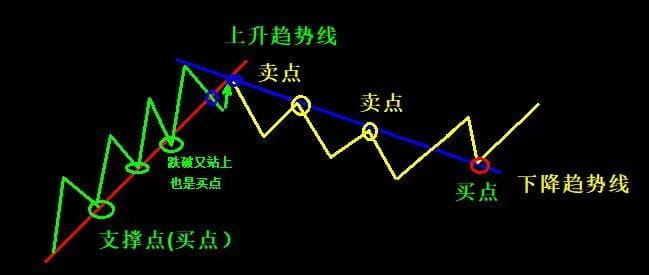
The figure shows the upward trend support and downward trend resistance lines.
The strength of a support or resistance potential depends on the following aspects:
The number of times the straight line has successfully withstood market tests; the amount of trading volume during each test; and the length of time the straight line remains effective.
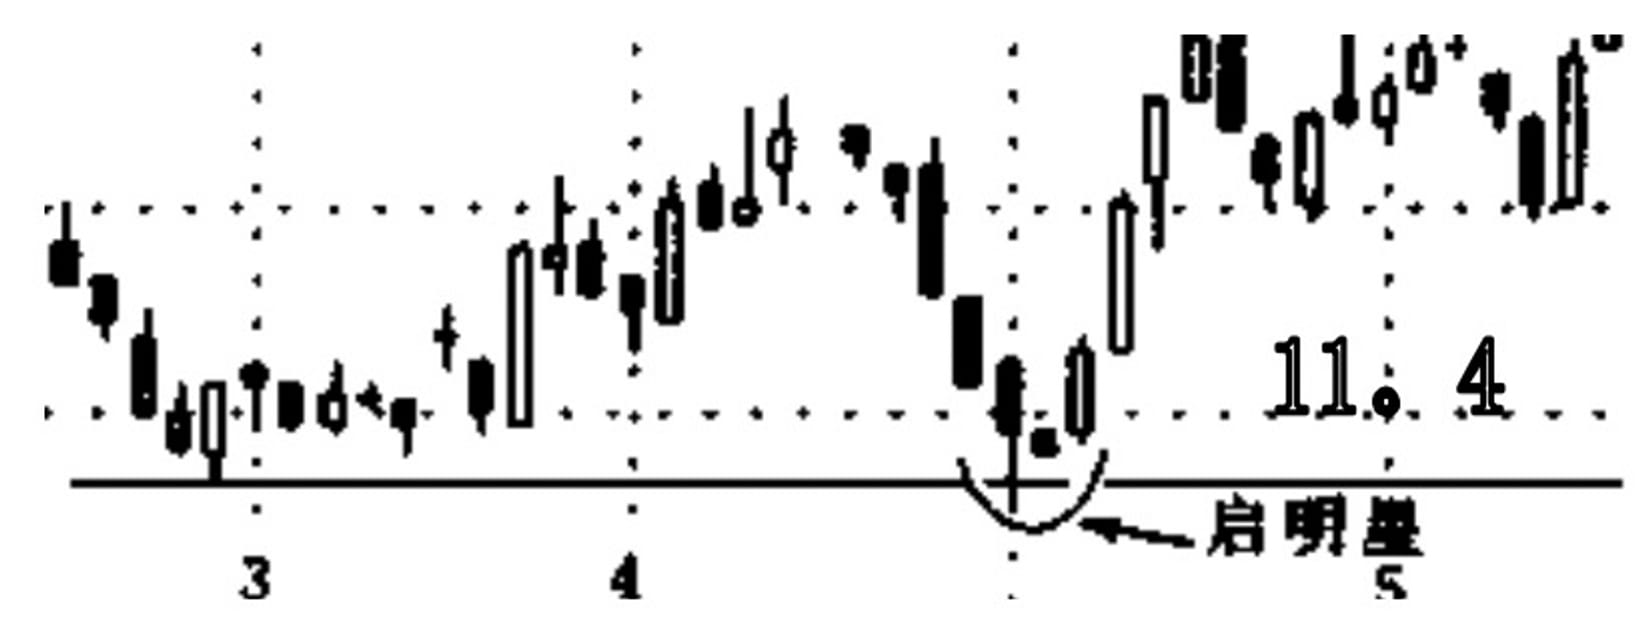
Figure 11.4: The lows of late March formed a support area. In late April, the market successfully tested it. From April 20 to 22, a Morning Star pattern was formed.
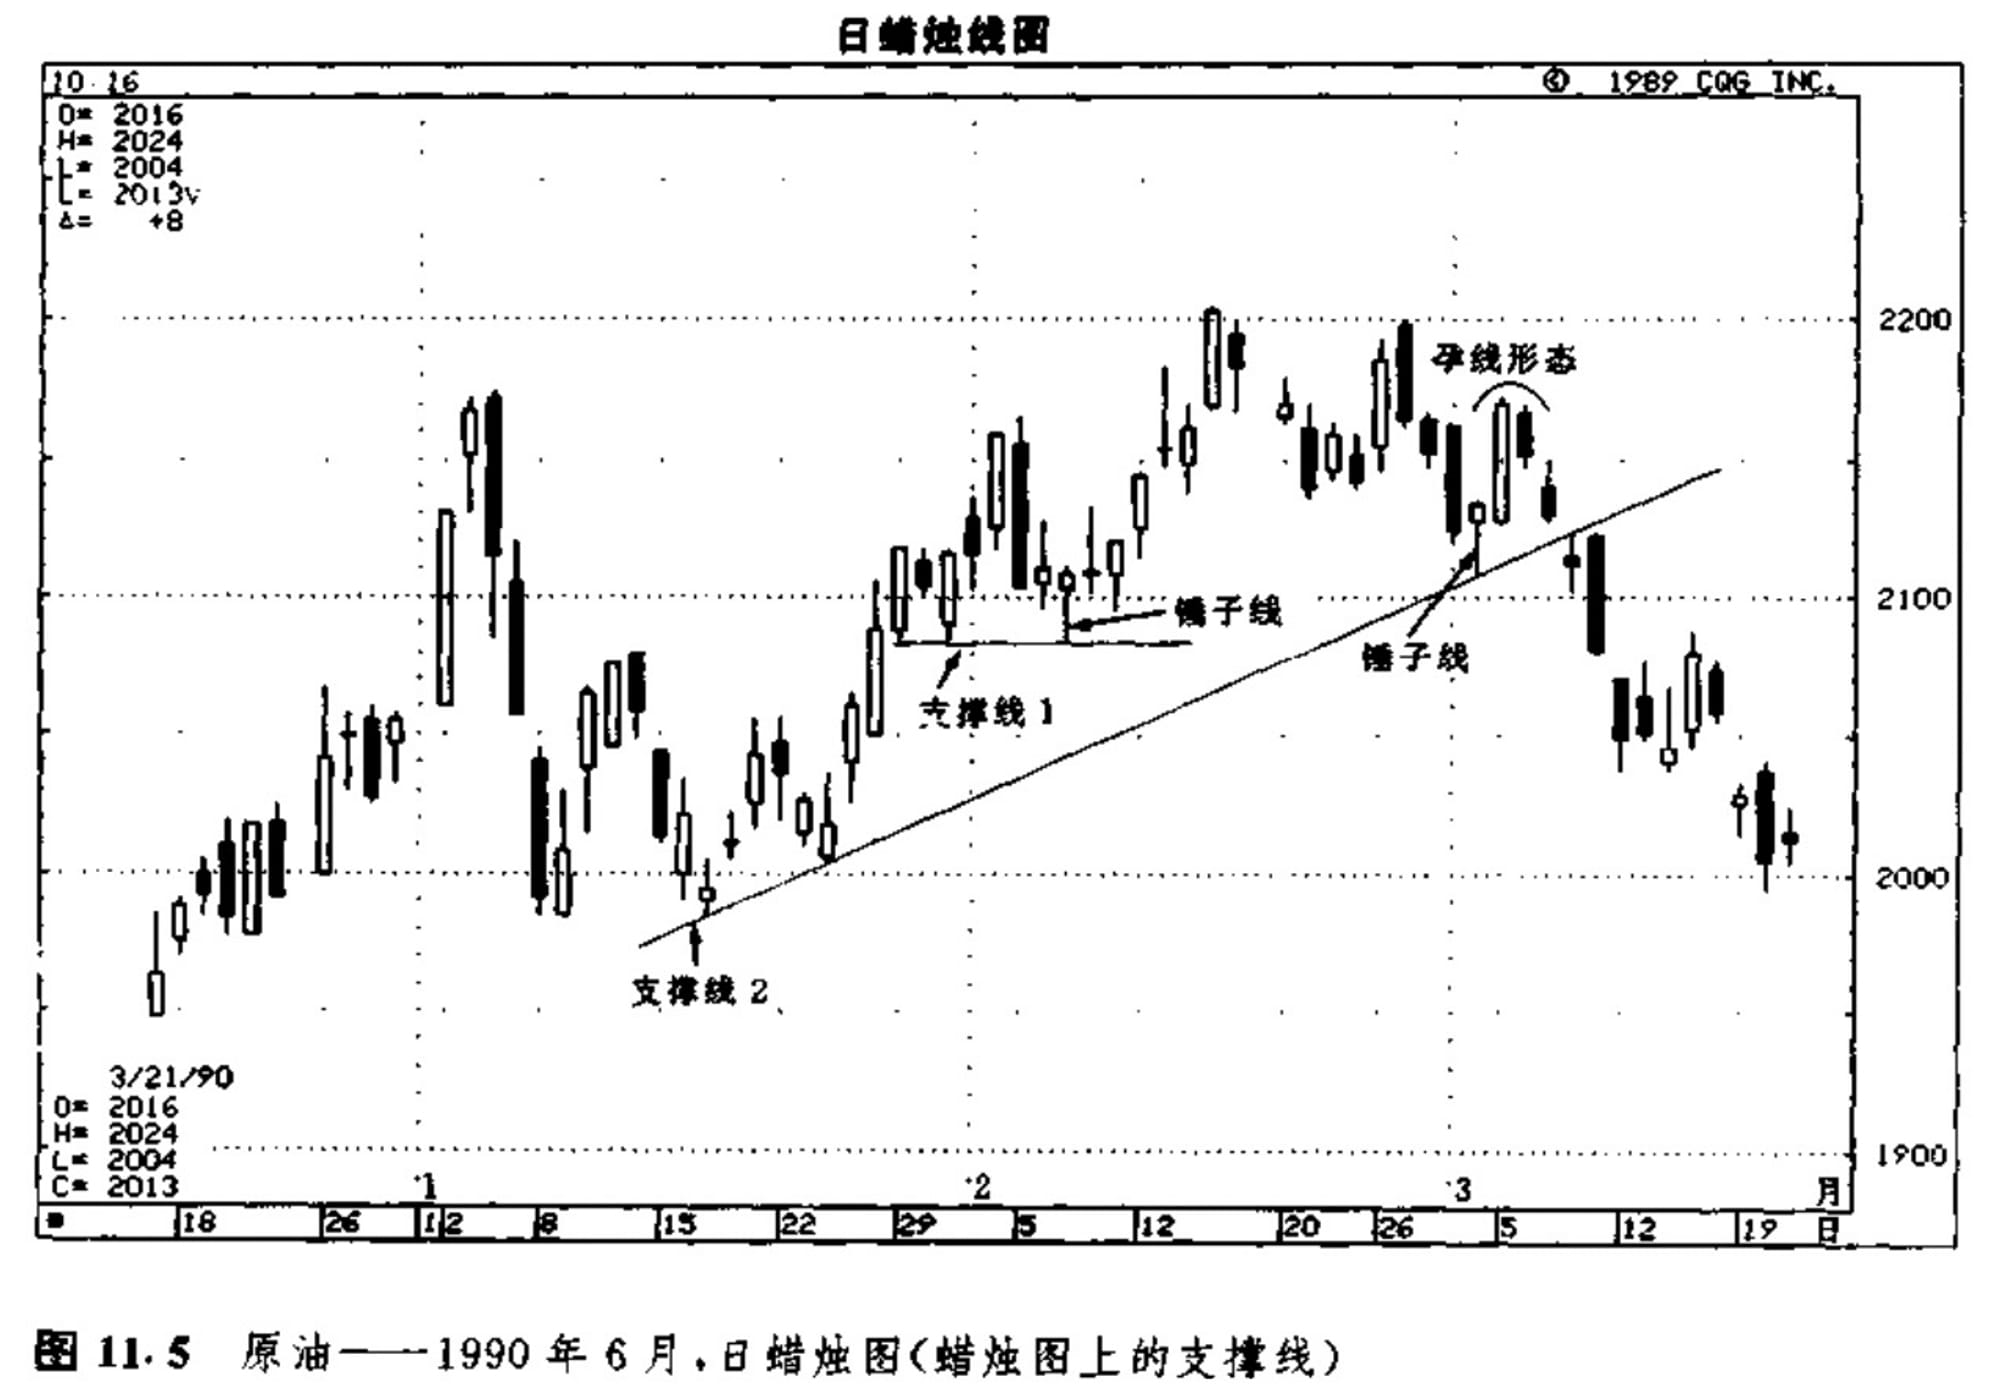
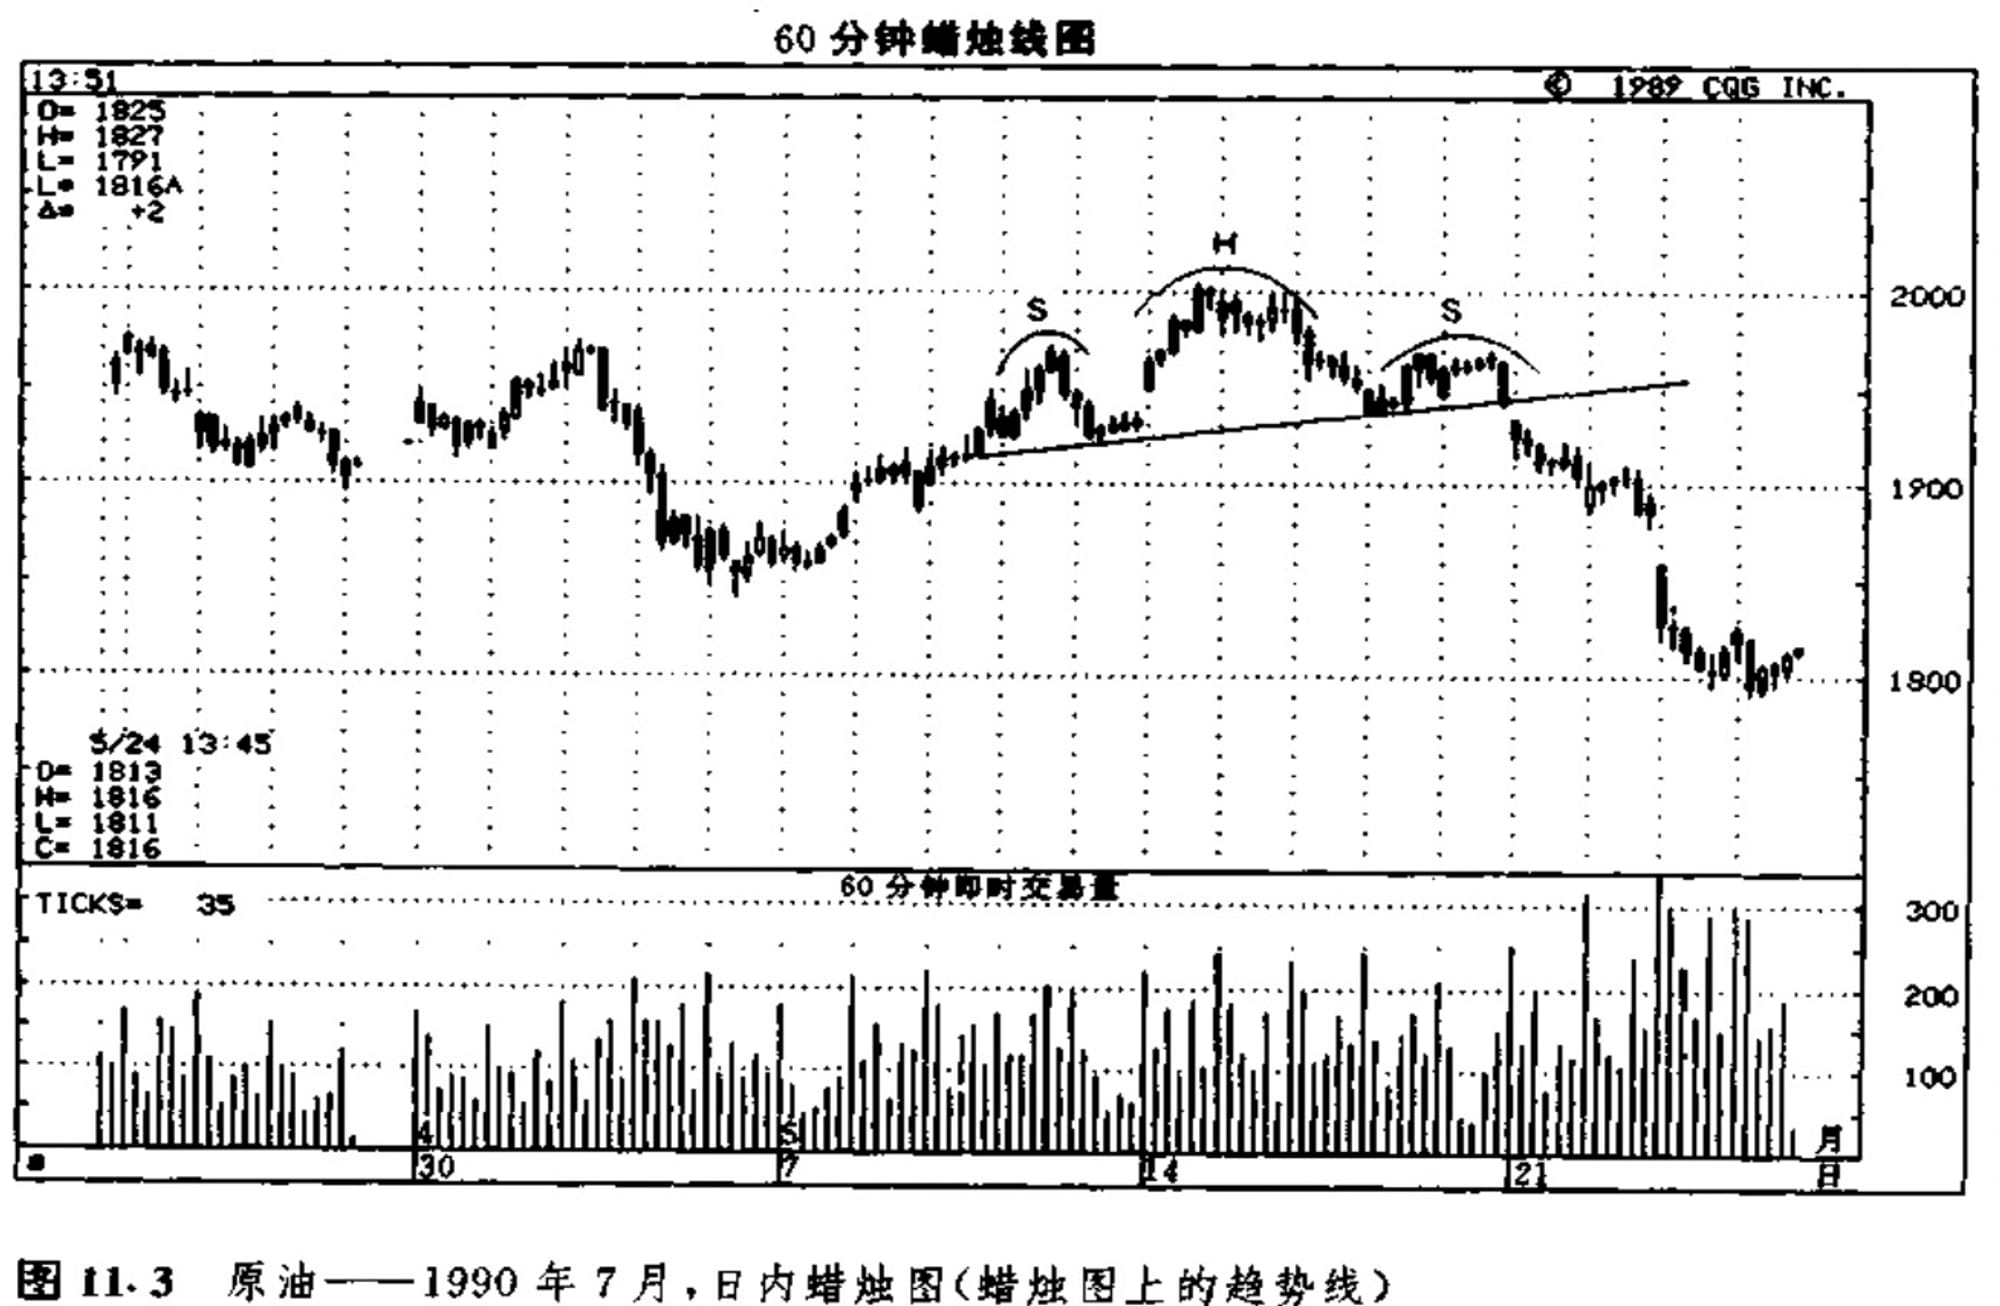
【Figure 11.5】Combined application of trend line and candlestick chart indicators: 1. In the formation of the support line 1 (from the end of January to the beginning of February), the first two decision points were the lows on January 29 and 31. February 7 was the third attempt of the market to reach this line, and it was also a bullish hammer line. The above two factors combined constitute a bottom reversal signal. For market participants who buy in this area, the low point of this hammer line can be used as a reference level for setting protective stop-loss orders.
2. Support line 2 (mid-January to early March) is more important than trend line 1 because it lasted much longer. On March 2, the market tested this line for the third time and formed a bullish hammer. Considering that the main trend was up (as shown by the upward sloping support line 2), the bullish hammer, and the successful test of this support line, these factors confirmed each other and converged into a buy signal on March 2. In this case, the protective stop order level can be placed below the low of the hammer line or below the rising trend line. If the market breaks down through this support line, it will constitute a warning signal that the previous uptrend may be in trouble. The subsequent harami pattern shows the first clues that the current trend is in trouble.
The Importance of Having a Protective Stop
Only when the market evolution is in line with our original expectations can we continue to hold the original trading position. If the subsequent price changes are contrary to our expectations, or even if they just fail to confirm our expectations, we should make a decisive move and close the position.
All long-term trends begin with short-term trends;
There is no room for wishful thinking in the market. The market does not care whether we follow its trend or not. It does not care about our ideas or our positions. There is one thing worse than making a mistake, and that is persisting in it. The ability to correct one's mistakes early is actually something to be proud of.
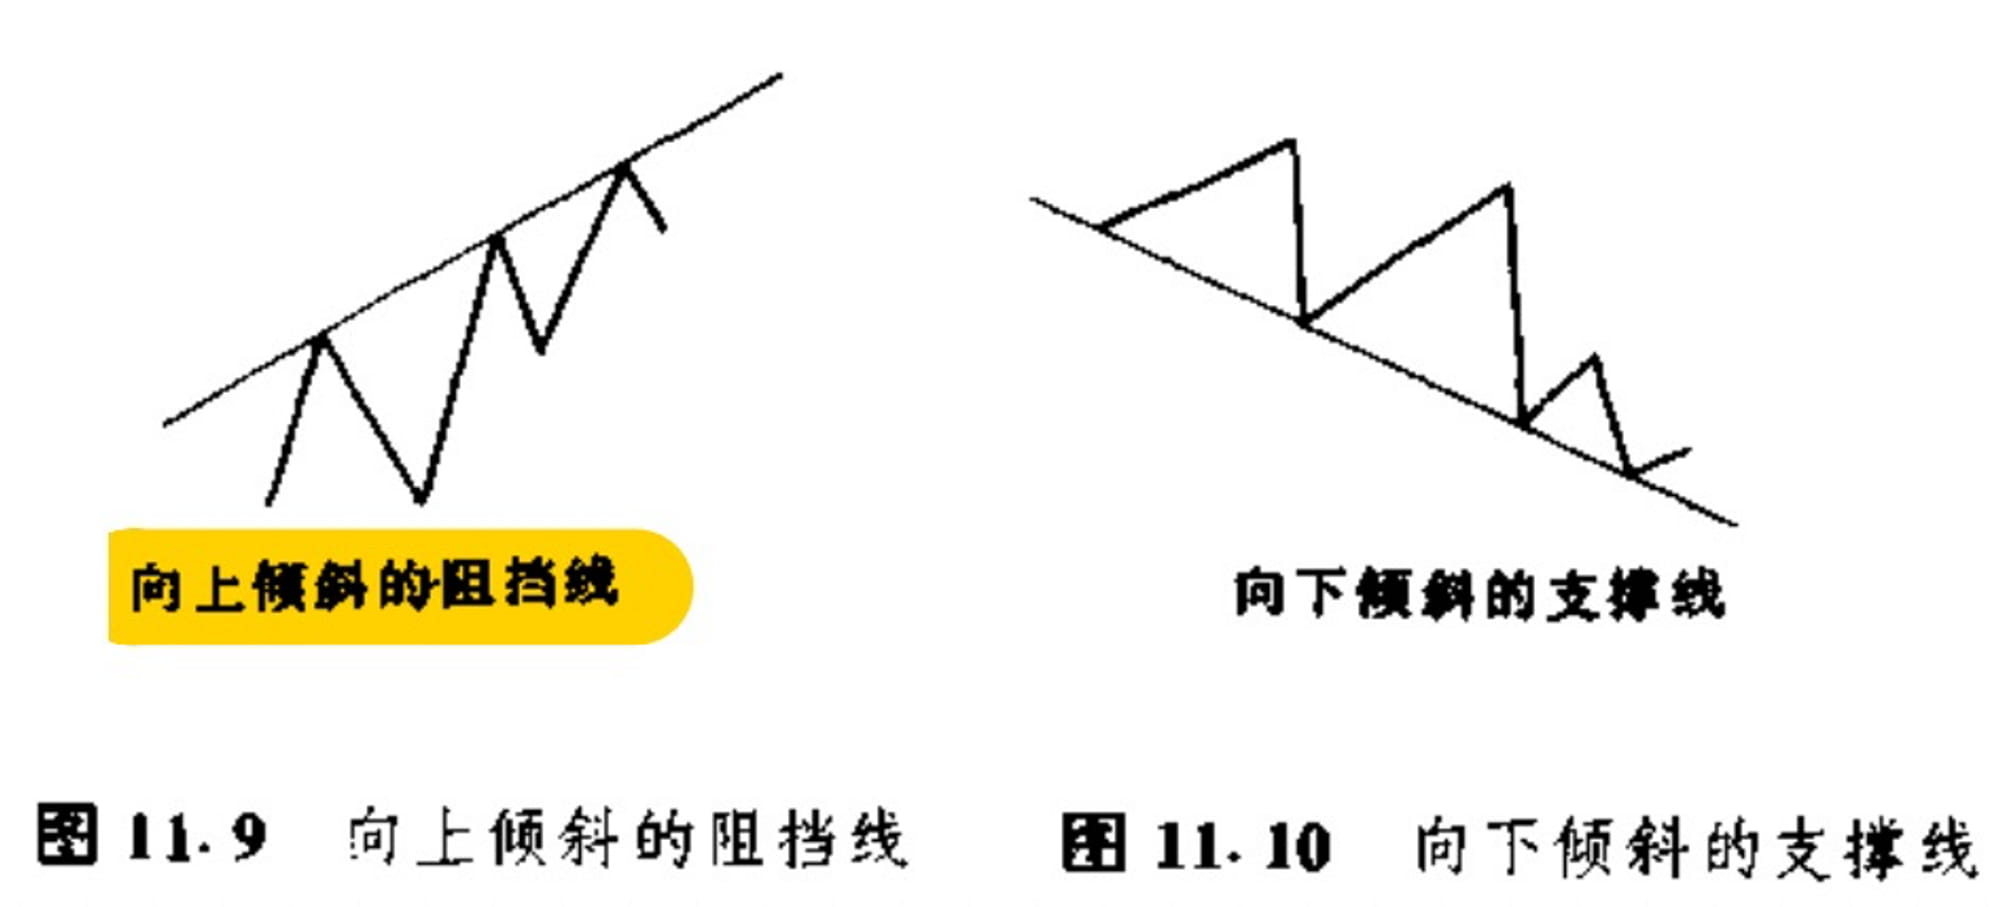
[Figure 11.9] is an upward sloping resistance line, which is a trend line connecting gradually rising high points. For bulls, when the market approaches this kind of straight line, bulls should take precautionary measures to prevent the market from falling back here. Although the above-mentioned decline process should be a temporary phenomenon (because the main trend is upward), if the market fails here, it may constitute a preliminary, experimental indicator, suggesting that the market may start a new downward trend from now on.
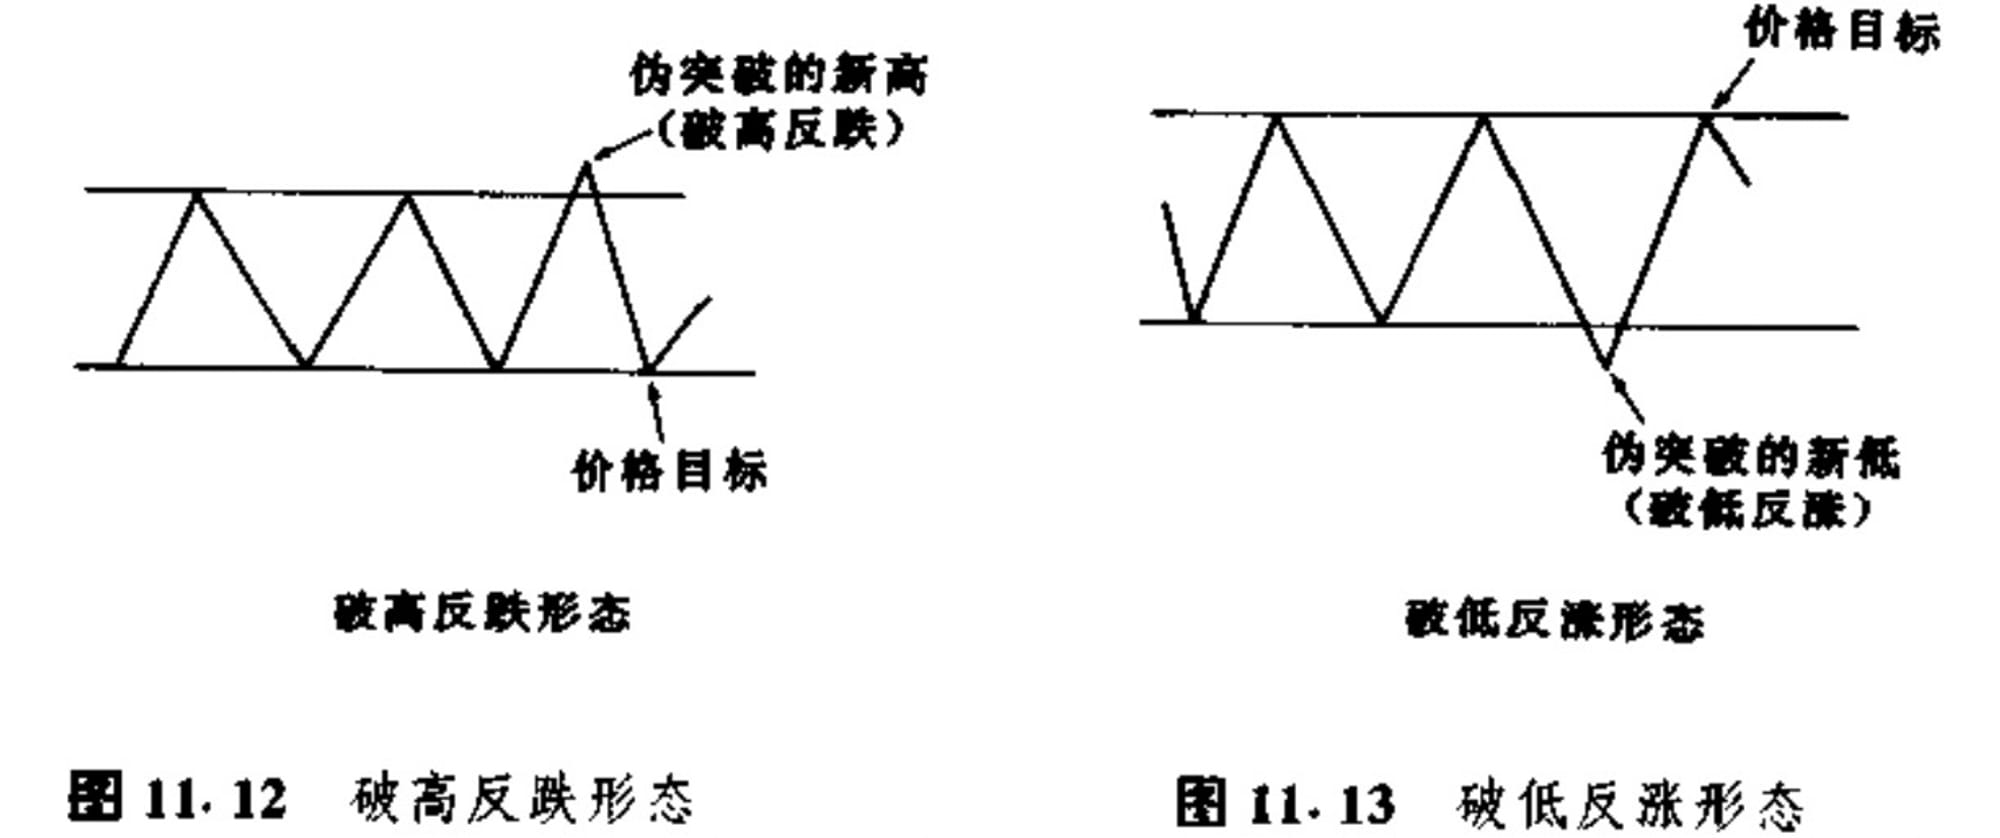
Breaking low and rising pattern and breaking high and falling pattern
The low-break-and-rise pattern and the high-break-and-fall pattern are applicable to the market that is not in a trend state (oscillation). In most of the time, the market is not in a trend state, but in a horizontal fluctuation range. In this case, the market has reached a relatively harmonious state. About 70% of the time, the market is in a non-trend state.
During the shock period, the market moves in a range. If the market temporarily breaks through a resistance level upwards or a support level downwards, but is unable to maintain the results (i.e. a "false breakout"), the market will return from this boundary of the horizontal consolidation range to the opposite boundary.
Polarity conversion principle
Past support levels evolve into new resistance levels; past resistance levels evolve into new support levels.
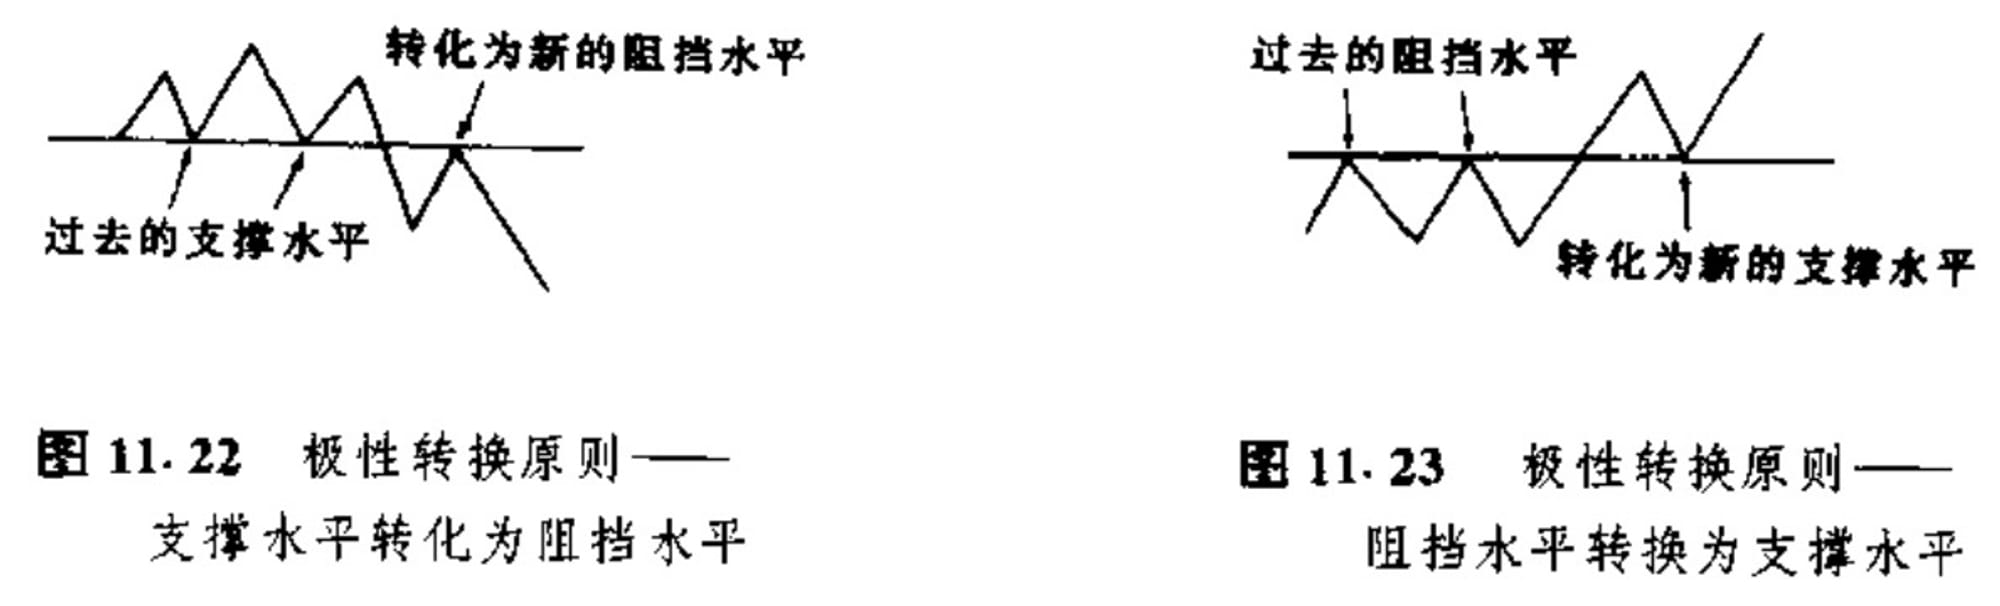
The technical potential of this polarity reversal phenomenon is proportional to the following aspects: 1. The number of times the market has tested past support/resistance levels; 2. The size of the trading volume and position size at each test.
The candlestick chart signal pb, inverted hammer, evening star, cross star and other forms, when the trend is reversed at the key position, is what we often call the reversal K. (Follow the homepage of Haoge, technical dry goods will not stop)