
#AkashNetwork #AKT #AKTUSDT
I am bullish overall to start the year but, as you might already know, I am not so bullish about the second half of this year when it comes to the overall market. Even without Bitcoin in bearish conditions in Q2-Q3 2026 the market still tends to fluctuate between bearish and bullish waves.
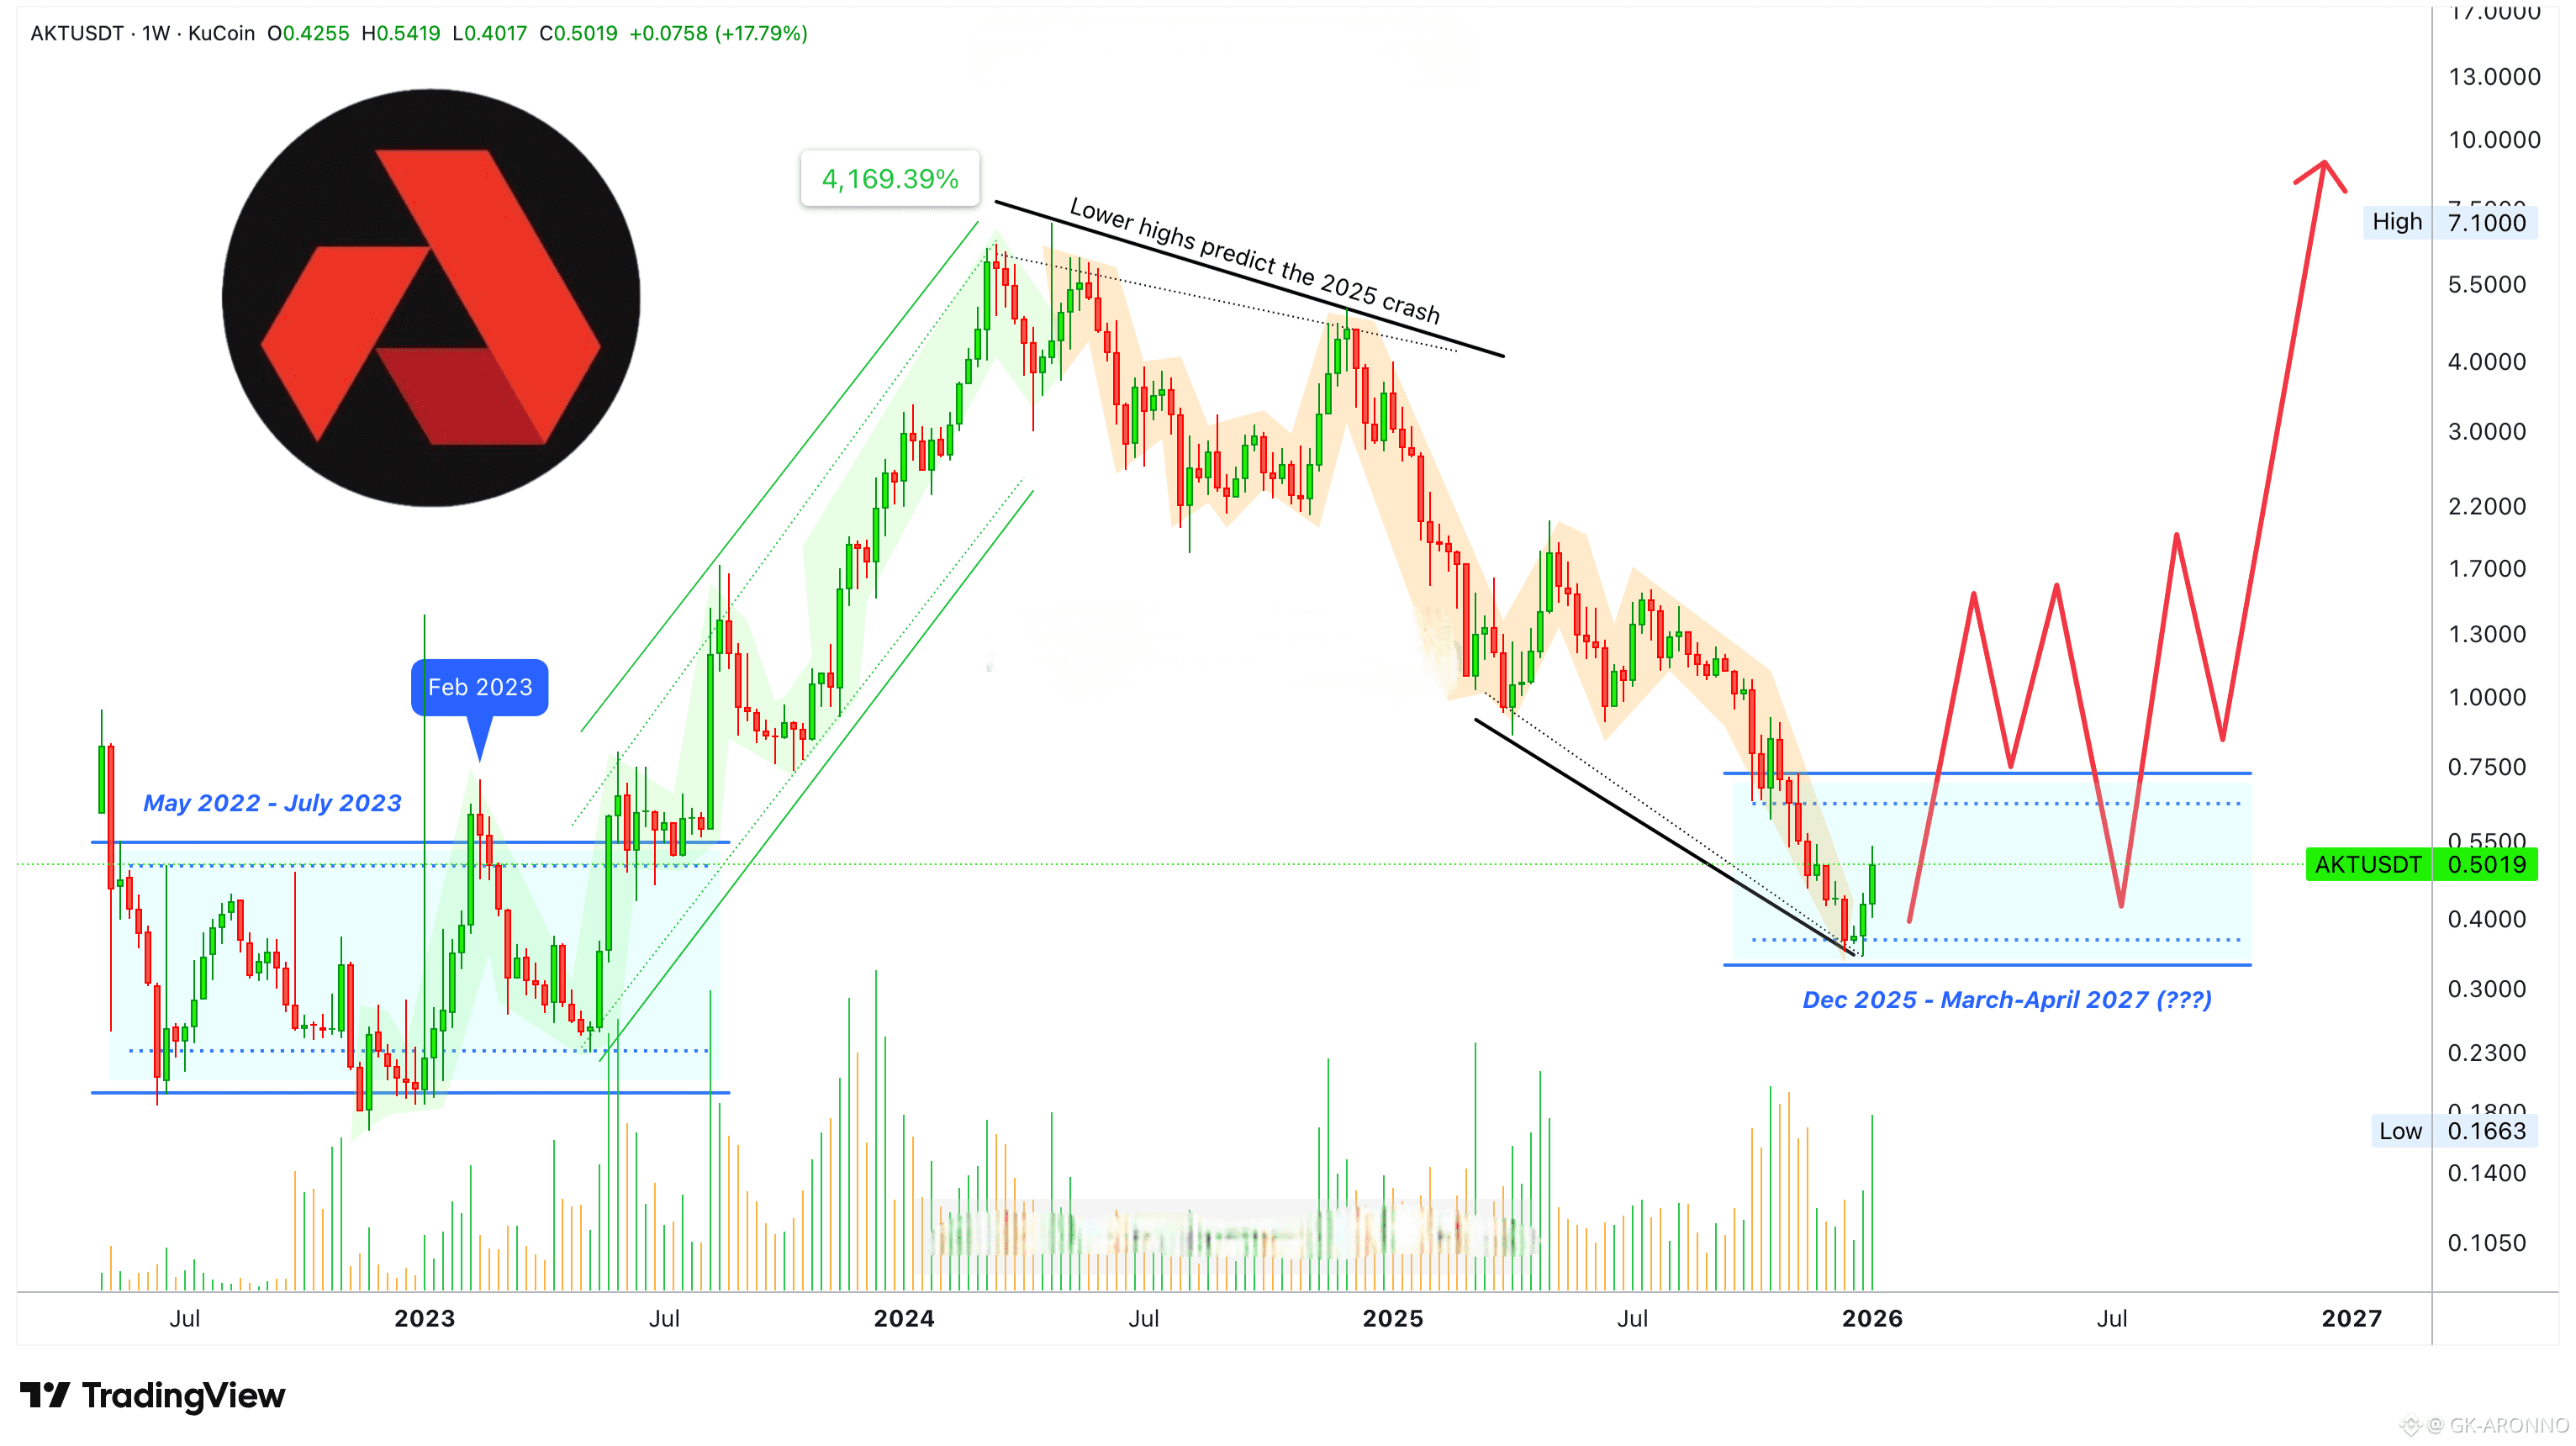
This scenario that I am depicting on the Akash Network chart can be valid for many altcoins. Notice the action between May-June 2022 through July 2023—left side of the chart. Something similar can happen at the start of 2026.
Say we get some bullish action now which is already happening. AKTUSDT has really high volume this week, a full green candle and the third week that will close green, also, a long long-term higher low. All this points to a bullish wave. Once this bullish wave reaches its end, prices can come crashing back down, fluctuate around the current support/buy zone to later keep on growing long-term.
Still predicting higher lows and overall bullish conditions for many projects, but others will not be so lucky.
So this can happen. Bullish fast and strong followed by bearish, prolonged and boring. The bearish period can start fast but then slowdown and proceed like this for several months. The duration will still be around 4-6 months with the usual strong variations.
A major rise is followed by a major drop. Notice how Akash Network grew more than 4,000% and naturally was followed by a bear market. The bear market in return will be followed by a new bull market. Rinse and repeat.
As the market evolves, the bull markets will last longer and price action will be more stable. Bear market becomes shorter and faster, as the market becomes older and more mature. The better the project, the stronger the chart.
Another project that can be glanced at to see what long-term growth looks like is Monero—XMRUSDT.
Thanks a lot for your continued support. I will share with you—for your entertainment—more charts.
Namaste.
✅ Trade here on $AKT