📌 What Is VANRY (Vanar Chain)?

VANRY is the native token of Vanar Chain — a blockchain project originally known as Virtua Kolect (TVK) that underwent a 1:1 token swap to VANRY when rebranded. The VANRY token is designed as the fuel of the ecosystem: it’s used for transaction fees, governance, staking, and accessing various network services.
The token has a fixed max supply of 2.4 billion and a large portion is allocated to validators, community incentives, and development — with no team tokens reserved in many allocations, which is uncommon for crypto projects.
📊 Current Price & Market Data
According to CoinMarketCap data:
Price: Around $0.0064–$0.0066 USD at the time of your screenshot.
Market Cap: Roughly $14–15 million.
Circulating Supply: ~2.25 billion VANRY.
All-Time High: ~$1.22 (Mar 2021).
All-Time Low: ~$0.0060 (recent).
This means the token price is significantly below its peak, showing high volatility and long-term decline — typical for many smaller altcoins.
📈 Price History (Past Years)
Looking at historical data:
Year Average Price Highest Lowest
2023 ~$0.055 ~$0.074 ~$0.046
2024 ~$0.129 ~$0.373 ~$0.051
2025 ~$0.033 ~$0.135 ~$0.0068
2026 YTD ~$0.0086 ~$0.0118 ~$0.0070
This shows that after some price strength in 2023–2024, VANRY declined sharply in 2025 with much lower prices and lower average value so far in 2026.
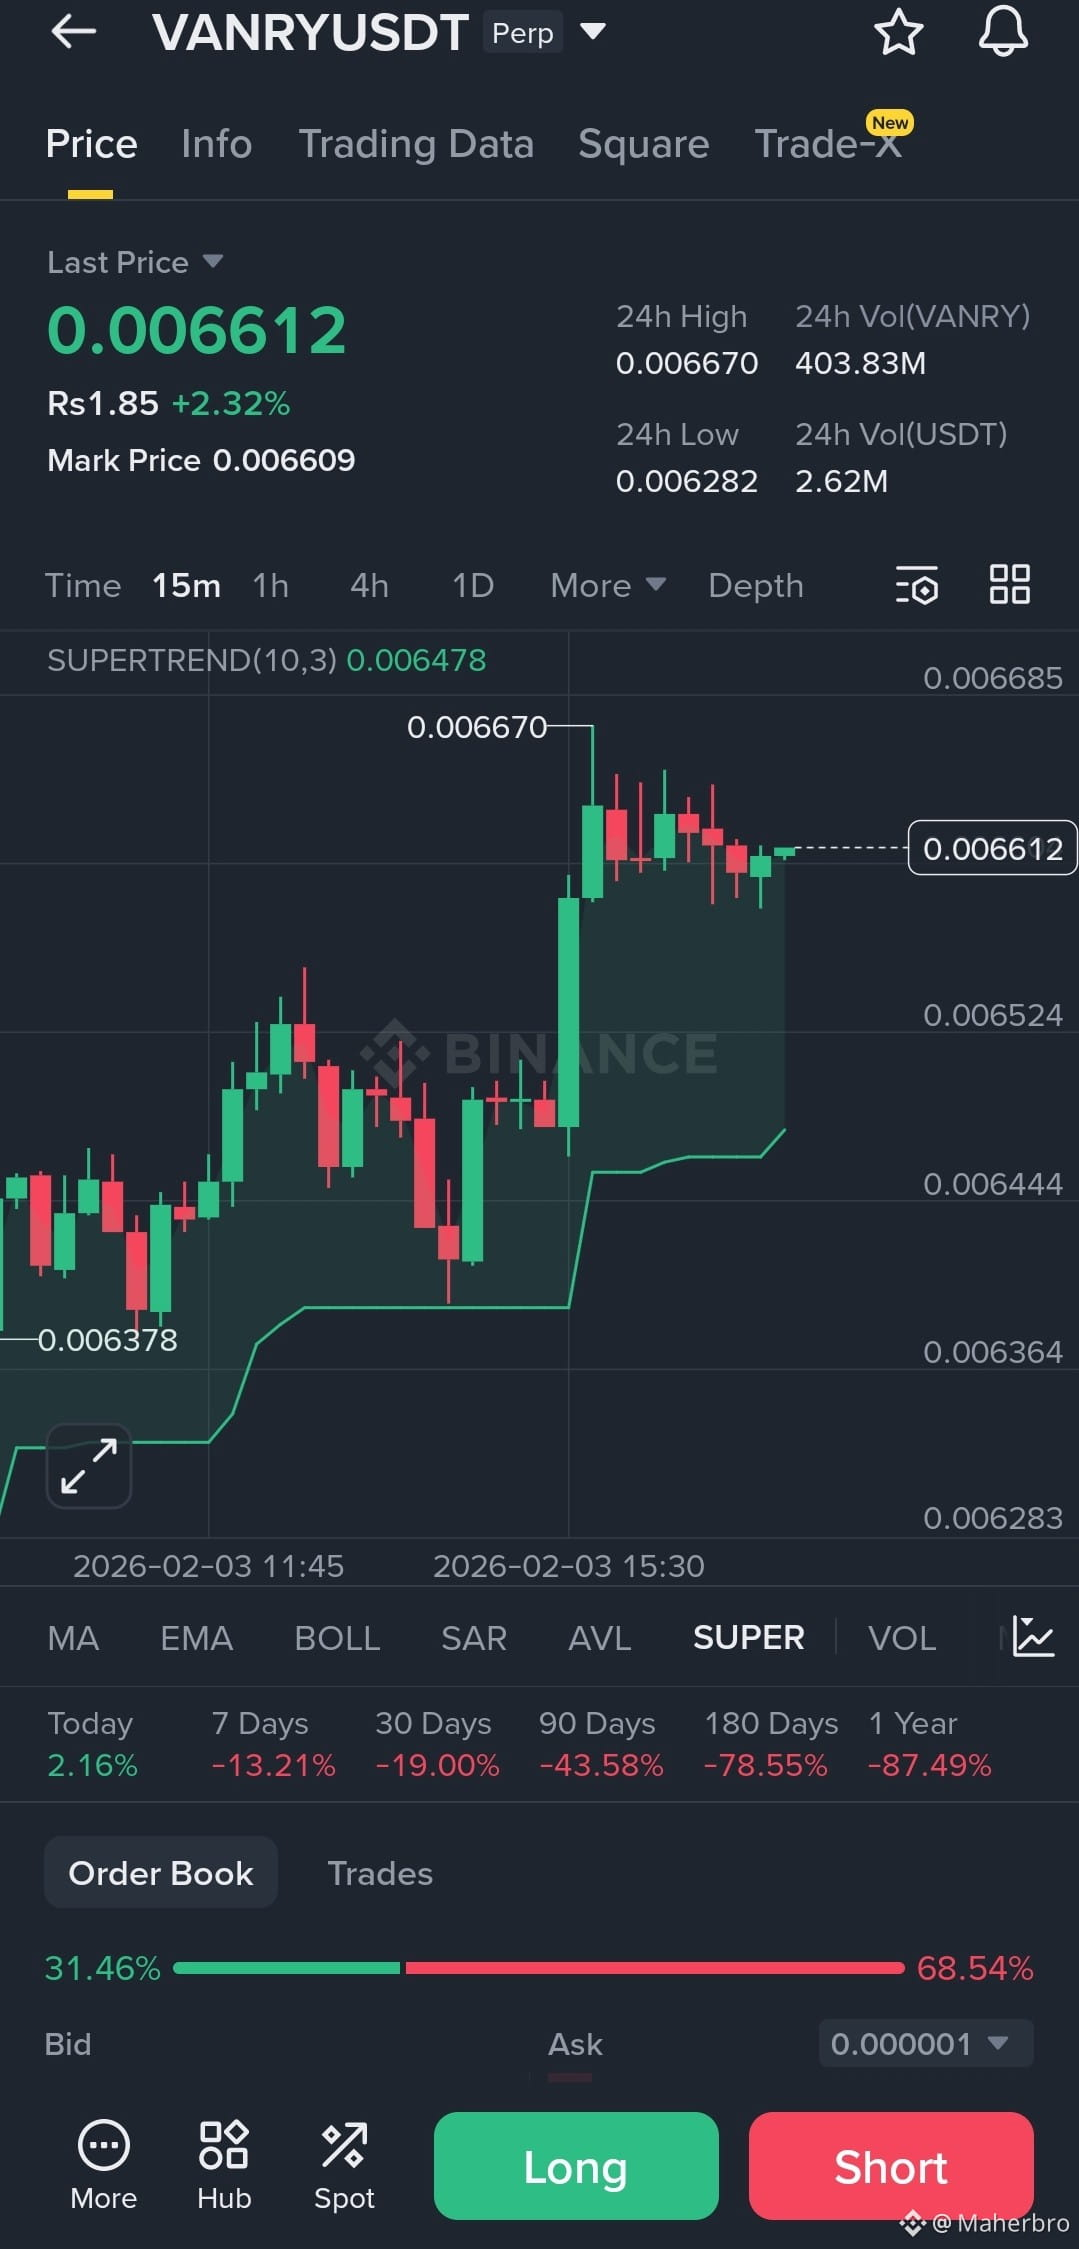
📊 Binance VANRYUSDT Price Chart — What It Suggests
The chart you shared shows the VANRY price in a Binance perpetual (perp) contract over short time frames (15 min). Key observations:
Price recent consolidation around ~0.0066 USD.
Volume still high on both sides (bid and ask), with sellers dominating slightly.
Short spikes and pullbacks, typical of low-liquidity tokens.
Short-term indicators like SuperTrend or moving averages (seen on Binance) help day traders only — they don’t provide a long-term trend. Perpetual prices can differ from spot prices with funding rates and leverage effects. Always verify with spot markets.
📍 Important: Charting tools and short time frames cannot reliably predict longer-term direction — for that you’d want daily or weekly analysis plus fundamentals like on-chain activity.
📊 Technical Signals from External Data (General)
Various technical summaries from Investing.com (which aggregates indicator data) show mixed signals across time periods:
Some analyses suggest Buy bias recently based on moving averages and RSI for VANRY/USD.
Other older summaries showed Strong Sell on longer looks — showing price weakness in 2025.
This kind of variation highlights that short-term technical indicators differ by exchange, time frame, and data source.
⚠️ Risks & What to Consider
🔹 High Volatility: VANRY has seen massive decline from its peak and can move sharply in either direction.
🔹 Liquidity: Smaller market cap tokens often have low liquidity and wide bid-ask spreads.
🔹 Perpetual Trades: Futures/perp markets add complexity (leverage, funding rates).
🔹 Project Utility: Real adoption and utility (staking, governance, network usage) matter more than short price swings.
Never trade more than you can afford to lose. Historical price performance is not a guarantee of future results.