BITCOIN’S BEAR FLAG IS REACHING DECISION TIME.
Lower highs.
Rising support getting pressured.
That green zone is the bulls’ last stand.
Break it clean
and momentum flips fully bearish.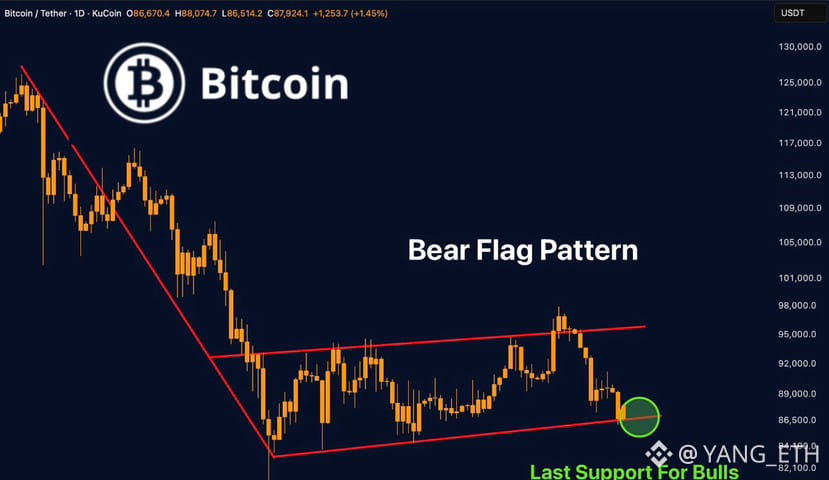
Where is Bitcoin?
Silver prices are now outperforming Bitcoin by one of their widest margins on record.
In ~13 months, Silver is up +270% as Bitcoin has fallen -11%.
This makes Silver's market cap 3.5 TIMES larger than Bitcoin.
The world is waiting on crypto.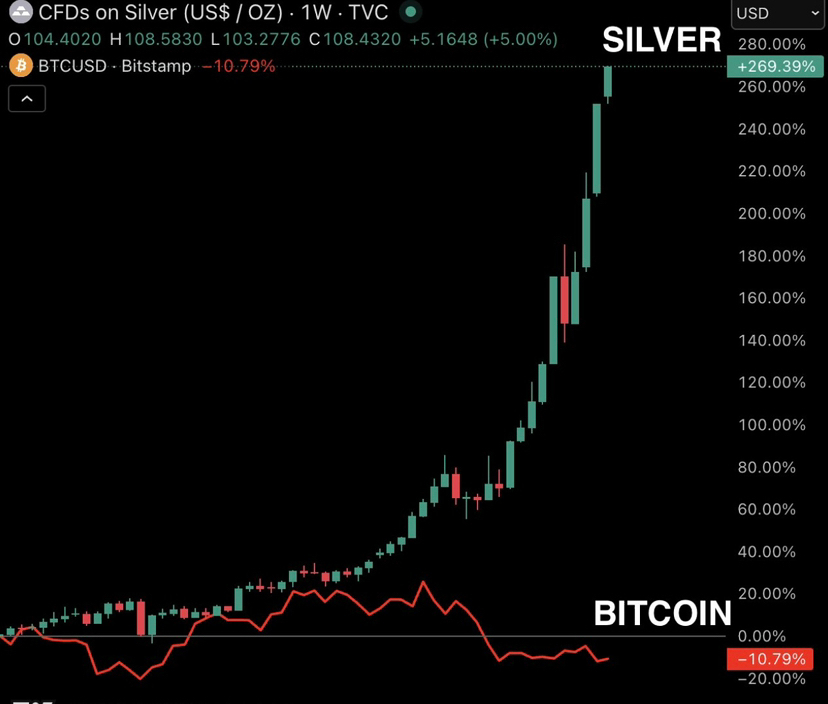
🚨 BREAKING:
ALTS ARE GEARING UP FOR A MASSIVE DOWNSIDE WAVE
ALTs/BTC CHART SIGNALED THIS IN 2017/2021
NOW HISTORY IS REPEATING - BE CAREFUL...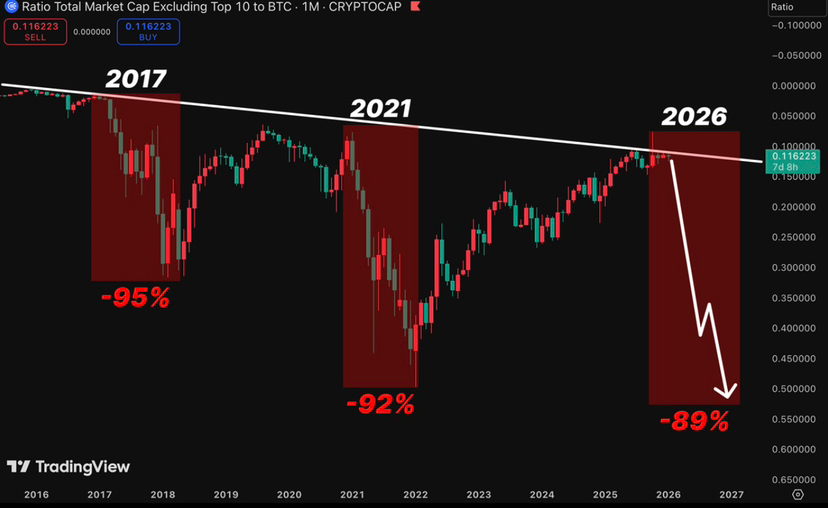
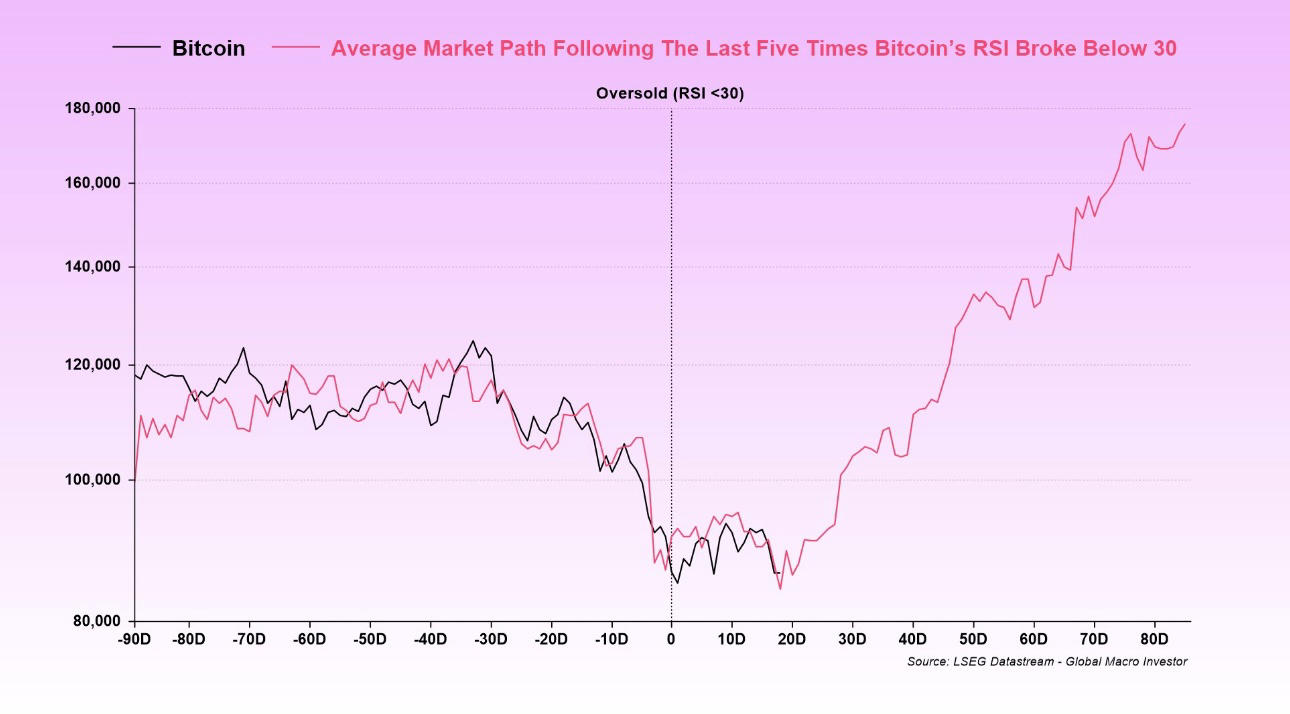
A lot of people have been asking for an update on this chart, so I’ll just leave this here for anyone who needs to see it.
This shows the average BTC trajectory following an oversold RSI reading, with RSI falling below 30 at t=0.
So far, it’s been pretty bang on.
Unless you believe the 4-year cycle is still in play, which we don’t, this chart should hold up contextually over time.
No, it won’t be perfect, but assuming the bull market isn’t already over, it’s a useful chart to keep in mind.
As we’ve outlined many times, based on our work on the business cycle, the current path of financial conditions, and our expectations for overall liquidity, the balance of probabilities is that this cycle extends well into 2026.
In that world, the 4-year cycle is dead.
Remember, the 4-year cycle was never about the halving, despite widespread belief that it is, but instead has always been driven by the public debt refinancing cycle, as outlined in our work at GMI, which post-COVID was pushed out by one year.
In our view, the 4-year cycle is now officially broken because the weighted average maturity of the debt term structure has increased.
And the bigger picture is that there is still a vast amount of interest expense that needs to be monetized, which has far exceeded GDP growth.
Another thing to keep in mind is that bases can take time to form and usually come with plenty of chop before the bigger up-move kicks in.
Finally, let me repeat what I said when I first posted this chart last month.
If you think the bull market is over and we are now facing twelve months of pain, this chart is not for you. Move along...