

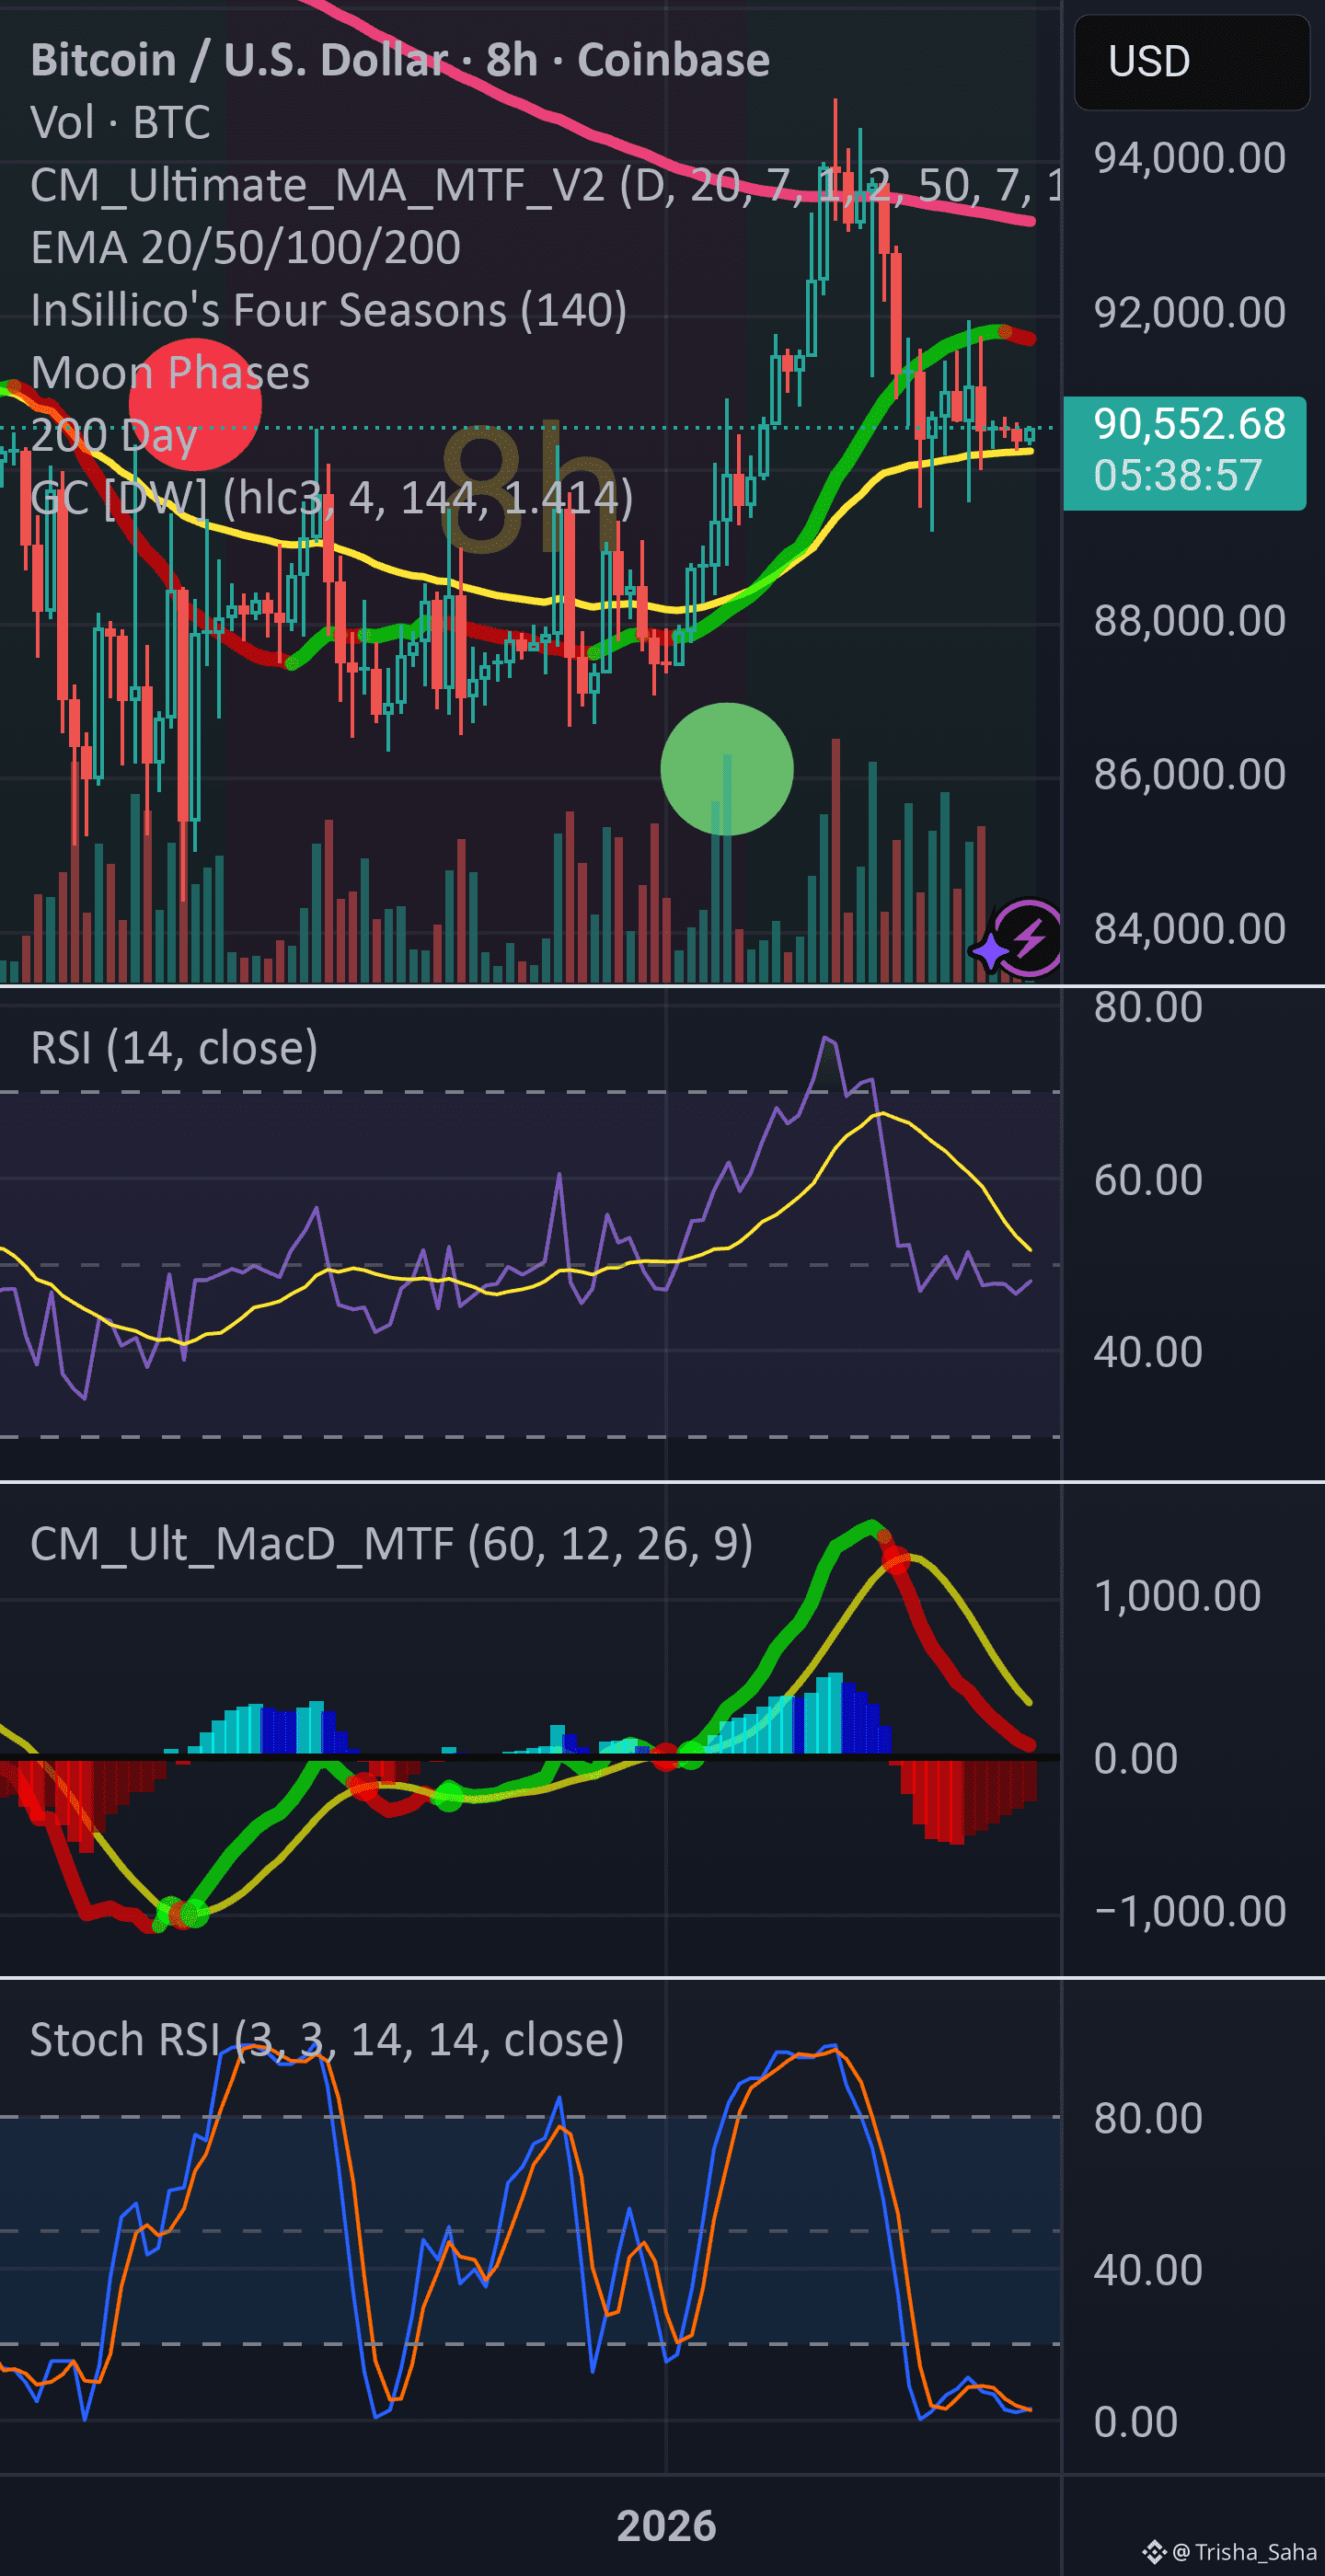
BTCUSD – 8-Hour Chart (Oracle System)
Current Price: ~90,566
Timeframe: 8H
Market State: Post-rally distribution
---
Indicators on This Chart
1) EMA Ribbon (20 / 50 / 100 / 200)
EMA 20 & 50 (short-term trend)
EMA 100 (mid-trend support) ≈ 90,100
EMA 200 (macro trend) ≈ 91,200
Price is below EMA 200 and hovering on EMA 100.
This creates a compression zone where trend flips are decided.
Structure = bearish until price reclaims EMA 200.
---
**2) CM Ultimate MA (Multi-Timeframe Trend)
** The Ultimate MA turned red at the top and is now curling downward.
This confirms trend exhaustion and distribution.
---
3) Moon Phase + Oracle Cycle
The green Oracle dot marked accumulation near 87k.
The red Oracle dot at the top marked distribution near 94k.
Price did exactly what the Oracle model predicts:
> Buy low → rally → sell into premium → start down-cycle
---
4) RSI (14)
RSI peaked in the 60–65 sell zone and rolled over.
Now:
Below its signal line
Falling
No bullish divergence
Momentum has flipped bearish.
---
5) MACD (MTF 60)
MACD lines crossed down
Histogram flipped red
This confirms:
> Trend momentum has turned negative — this is not a healthy uptrend.
---
6) Stochastic RSI
Stoch RSI ran to overbought and dumped back near 0–10.
That means:
> The bounce is already exhausted — sellers have control.
---
Price Structure
Price failed at:
93,200 – 94,300 (200-day MA + trendline + Oracle sell zone)
It dumped to:
~89,400
Now it’s stuck between:
EMA 200 (91,200)
EMA 100 (90,100)
That creates a bear-flag / distribution shelf.
---
Key Levels
Resistance
91,200
92,000
93,200 – 94,300
Support
90,100
89,400
88,200
86,800 (next Oracle buy zone)
---
Signal Status
Trend: Bearish
Momentum: Bearish
Cycle: Distribution → Down-leg starting
Oracle: Sell week completed → move toward discount zones
---
Quick Next-Move Summary
BTC is not in a breakout phase.
It is in a post-distribution compression.
This structure favors:
> Another push lower toward 88,000 – 86,800
That is where the next Oracle accumulation zone sits.
Only a reclaim of 92,000+ would invalidate this.
Right now the chart is signaling: Sell strength → wait for lower buy zone.
