Alright team, let's break down this juicy $BNB chart and see what's cooking. The recent correction following the macro move has given us a prime "buy the dip" entry opportunity.
Technical Analysis
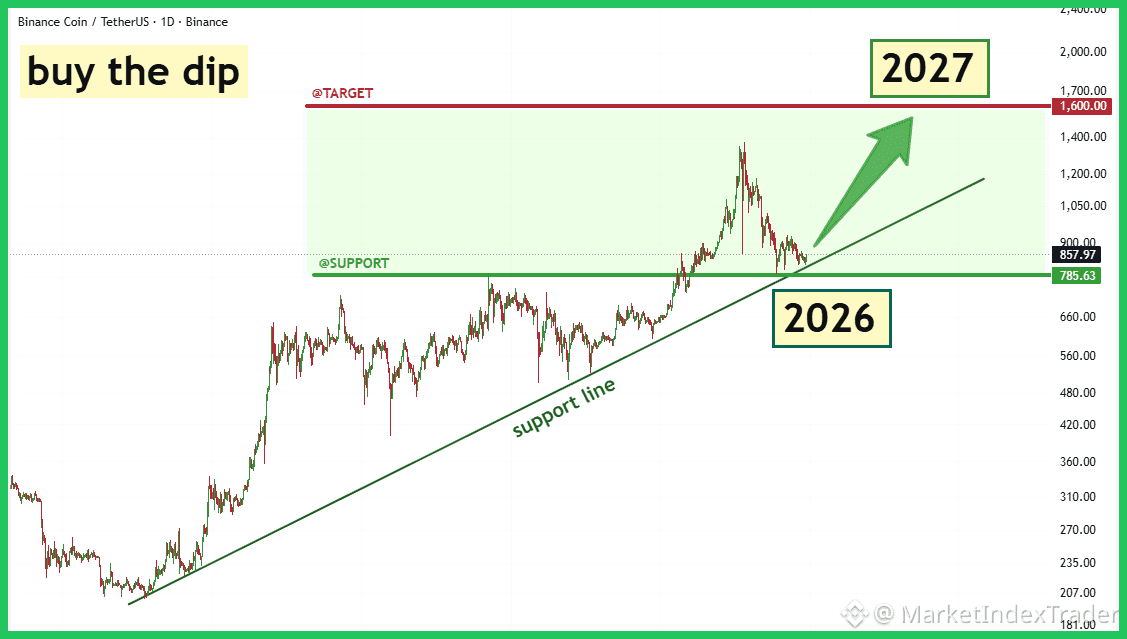
Looking at the 1D chart, $BNB has pulled back perfectly to the confluence of two major support levels. The long-term rising support trendline has been tested, coinciding with the crucial horizontal support zone between $785 and $830. The current price action (around $857) suggests strong demand is entering the market here. Holding this zone is absolutely key for the continuation of the macro uptrend. Our primary long-term target, based on structural expansion, remains the $1,600 level.
Fundamental Tailwinds
On the fundamental side, $BNB continues to benefit massively from the constant flow of high-quality projects launching on Binance Launchpool and Launchpad, driving consistent utility and staking demand for the coin. Furthermore, the scheduled quarterly token burns ensure a sustained deflationary mechanism, structurally reducing supply and supporting long-term value.
Action Plan
This zone is highly favorable for dollar-cost averaging (DCA) and establishing core positions. Accumulate close to the trendline support. A confirmed daily close above the $900 mark would be the immediate trigger signaling that the correction is over and the next major leg up has begun.
Highly recommend HOLD and Stacking $BNB at Binance
Feel free to comment the altcoin you are holding and we will check it for you!
#BNB #BinanceSquare #TechnicalAnalysis #Crypto #BuyTheDip #Altcoins
